Course Schedule
Pinned Google Doc for all meeting minutes: https://docs.google.com/document/d/1YrB1OZj_mg9sZ1ZG4f6e5vFknT1cacSkP0vV_Brmhzk/edit
Week One: Introductions
Wednesday, 9/30:
Syllabus overview, introduction to learning about the history of slavery, sign in to course website, learn navigation around WordPress, how to create a blog post
- Tell me about yourself!
- Sign up for HST251-ddh Slack
- Sign in to the course website (http://hst251.jenniferandrella.com/admin)
- Sign in to MSU Mediaspace (especially if you are a first time user)using your MSU netID and password to be able to access recorded class sessions.
- Gabrielle Foreman, et al. “Writing about Slavery/Teaching About Slavery: This Might Help” crowd-sourced document
Blog post 1 (due Saturday by Midnight): Write a post introducing yourself. Looking through the course schedule, is there a particular week/topic that you are excited about? Conversely, is there a particular week/topic that you are nervous about? There is something almost ironic about taking a “digital” history course “online” during the pandemic… how has the change to online learning made you think differently about this style compared to traditional classroom learning?
Week Two: Historical Thinking and Research Collections
Monday, 10/5:
Discuss Reading: Schermerhorn Introduction, Chapter 1
Technical Activity:
In class, we will take detailed notes about the thinking process, step by step, as we read and work with the following group of primary sources. Use all of these resources available to you to come to some conclusions based on the information available in the documents. Note the additional questions these documents raise, what other information would be useful to you?
- Together, we will design a step by step process for providing a good reading of a set of historical documents
- A Model of Historical Thinking (PDF)
- Google Doc Access: https://docs.google.com/document/d/1YrB1OZj_mg9sZ1ZG4f6e5vFknT1cacSkP0vV_Brmhzk/edit?usp=sharing
Primary Source Packet: Slavery in the Age of Revolutions- transnational context
- Painting: Linen Market, Dominica: http://slaveryimages.org/s/slaveryimages/item/2513
- Revolution pamphlet, 1776: https://www.loc.gov/item/rbpe.03902700/
Wednesday, 10/7:
Discuss Reading:
-Schermerhorn Chapter 2
-Sam Wineburg, “Thinking Like a Historian,” TPS Quarterly, 2010.
-*optional: check out the New York Times’ 1619 project
-*optional: Is 1619 really the operative year? See Michael Guasco, “The Fallacy of 1619: Rethinking the History of Africans in Early America,” Black Perspectives, September 4, 2017.
Technical Activity: Digitized Primary Sources
- Copyright and Fair Use of digital sources
- Search and Navigation of rights and access
- Google: Advanced Search | Refining Results | General Support
- Google images advanced search, Creative Commons licensing
- Chronicling America: Historic American Newspapers: https://chroniclingamerica.loc.gov/
- The Library of Congress: https://www.loc.gov/
- DPLA: https://dp.la/
- Pre-curated collections (see Sources and Data Sets page for more!):
- Documenting the American South: https://docsouth.unc.edu/
- Frederick Douglass Papers (Library of Congress): https://www.loc.gov/collections/frederick-douglass-papers/about-this-collection/
- Omar Ibn Said Collection, LOC: https://www.loc.gov/collections/omar-ibn-said-collection/about-this-collection/
- Google: Advanced Search | Refining Results | General Support
Blog Post 2: Considering the readings so far and your interests from them, form a research question. Think about how you would locate primary, historical sources that might begin to help you answer that question. How might your findings cause you to reframe your question? What can you reasonably answer with the materials available? What materials would you like to access that are not digitized? What are your next steps? Write a blog post about your preliminary research process in a digital context.
Week Three: Metadata and Close Reading of Primary Sources
Monday, 10/12:
Discuss Reading:
-Schermerhorn Chapter 3
-Jessica Marie Johnson, “Markup Bodies: Black [Life] Studies and Slavery [Death] Studies at the Digital Crossroads,” Social Text, 36(4), 2018, 57-79. * If this link doesn’t work, search for the article on MSU library’s catalog.
Technical Activity: Structured Data and Metadata
- What did you learn from documenting your research process?
- Markup Bodies: What do we need to consider when we work with data about enslavement?
- What does Johnson have to say to Schermerhorn?
- Considering metadata at the Omar Ibn Said Collection, LOC: https://www.loc.gov/collections/omar-ibn-said-collection/about-this-collection/
Wednesday, 10/14:
Discuss Reading: Schermerhorn Chapter 4
Technical Activity:
- Intro to Content Management Systems- Omeka
- Our class Omeka Website: http://omekahst251.jenniferandrella.com/
- To log in, add /admin to the URL: http://omekahst251.jenniferandrella.com/admin/
- How to add an “Item” and using Dublin Core metadata
- Find primary, historical sources that interest you and are related to the topics we’ve covered in class. Browse the links in the sources and data sets page to find your sources.
- Save image(s) representing the primary source to your computer.
- Log in to Omeka and go to the dashboard, click item -> “add an item.” Craft full and thoughtful metadata in Dublin Core and Item Type metadata for the source. Don’t forget to make your items “public” when you are finished.
- Once you add the item, it will appear in the “items” tab with your fellow classmates. Check out the public-facing side of the item by clicking on the item title.
Blog Post 3: Create two Omeka items (one visual (photo, object, painting, etc) and one text/document source) with complete metadata entered into Dublin Core. When you complete your two items, link the public-facing page for both items in a blog post on our WordPress website. Next, write about the sources you chose and the information available (or unavailable) about them. You may also reflect on the process of item creation. Next, carefully analyze your sources; what research questions might they raise?
Week Four: Narrative and Scholarly Communication
Monday, 10/19:
Discuss Reading: Schermerhorn Chapter 5
-Watch: Anna: An Animated Historical Short
Technical Activity: Research Questions and Audience
- Evaluation Brainstorming [Crowdsource into class Google Doc]
- “The Valley of the Shadow: Two Communities in the American Civil War,” http://valley.lib.virginia.edu/.
- Edward Ayers and William G. Thomas, “The Difference Slavery Made,” The American Historical Review (2003), (http://www2.vcdh.virginia.edu/AHR/).
- Freedom On the Move: https://freedomonthemove.org/
Wednesday, 10/21:
Discuss Reading: Schermerhorn Chapter 6
Technical Activity: Exhibit Design and Information Architecture- project critiques
- American Historical Association guidelines for digital history projects
- Journal of American history reviews
- Deconstruct this review of the Raid on Deerfield website
- Visit the Raid of Deerfield digital project
- What is the right balance between narrative and sources/evidence?
- Consider this Omeka-based project: Martha Washington- A Life
- Omeka exhibit design example and informational tutorial (*not required for blog post*)
- Evidence
- Storyboarding
- Final product
Blog Post 4: Write a comparative website review of two websites that are paired together below (See the Journal of American History‘s Digital History Review Criteria). Examine the strengths and weaknesses of the website, how the information is presented, and its accessibility for readers.
A. Lest We Forget: The Triumph Over Slavery (NYPL): http://digital.nypl.org/lwf/flash.html
A. Slavery in New York (New York Historical Society): http://www.slaveryinnewyork.org/
B. The Geography of Slavery in Virginia (UVA): http://www2.vcdh.virginia.edu/gos/
B. Freedom On the Move: https://freedomonthemove.org/
C. Frederick Douglass National Historic Site (Google Cultural Heritage Story): https://artsandculture.google.com/partner/frederick-douglass-national-historic-site
C. Frederick Douglass National Historic Site (Virtual Museum Exhibit): https://www.nps.gov/museum/exhibits/frdo/index.html
D. Revisiting Rebellion: Nat Turner in the American Imagination (American Antiquarian Society): https://americanantiquarian.org/NatTurner/
D. The Portent: John Brown’s Raid in American Memory (Virginia Museum of History and Culture): https://www.virginiahistory.org/collections-and-resources/virginia-history-explorer/portent-john-browns-raid-american-memory
Week Five: Podcasting and Communication as Public History
**Download Audacity using the PDF tutorial: andrella_audacitytutorial **
Monday, 10/26:
Discuss Reading:
-Schermerhorn Chapter 7
-Jim McGrath, “Podcasts and Public History,” History@Work, National Council on Public History, September 11, 2019.
-Listen to “How do the Legacies of Slavery and Jim Crow Laws Still Affect Americans Today? With Deborah N. Archer,” episode 149, Getting Curious with Jonathan Van Ness, February 19, 2020.
Technical Activity: virtual LEADR visit with Dan Fandino
- PDF: How to download Audacity: andrella_audacitytutorial
- PDF: Recording Podcast Audio: Audacity guide Audio Recording at Home – HST 251
- PDF: Editing in Audacity: Audacity guide
**special homework: prepare your script, record, and attempt to edit using audacity between Monday and Tuesday. This attempt is important, because Dan will join us again on Wednesday for a refresher on Audacity, and to answer any questions you may have.
Wednesday, 10/28:
Discuss Reading: Schermerhorn Chapter 8
Technical Activity: virtual LEADR visit with Dan Fandino
- Editing audio files in Audacity refresher
- Ask Dan any questions!
- How to export and upload an Mp3 to WordPress
Blog post 5: Instead of a written blog post, you will record an informational podcast “episode” that you will edit using Audacity, export as an Mp3, and upload as media in a “blog post” to our class website. You may select any topic that we have discussed in class thus far and incorporate any supporting primary source materials by conducting some light research using the “Sources and Data Sets” page. Your podcast should be at least 5 minutes long (no maximum time limit). Be creative- write a script, construct an interview, add audio clips, etc. The choice is yours! DUE ON MONDAY
Week Six: Geospatial Analysis and Mapping
Monday, 11/2:
Discuss Reading: Schermerhorn Chapter 9 and 10
-White, Richard. “What Is Spatial History?” The Spatial History Project, February 1, 2010. http://web.stanford.edu/group/spatialhistory/cgi-bin/site/pub.php?id=29.
Technical Activity: Narrative Map Construction
- Explore some narrative maps, decide on pros/cons of using geography-centered histories.
- Mapping Slavery in Detroit
- Extra: Mapping the Upper Missouri (Georectification example)
- Optional: Mapwarper-tool to georectify historical maps (see the tutorial)
- Map repositories: Library of Congress Maps, David Rumsey Map Collection
- Build a narrative map using Knightlab’s StoryMap JS
Wednesday, 11/4:
Discuss Reading: Schermerhorn Chapter 11 and 12, Conclusion
Technical Activity: Data Map Construction using Flourish
–Example: Visualizing Emancipation (See also: Commentary article)
-Example: The spread of US Slavery- Lincoln Mullen
-Census Data: https://www.nhgis.org/
Build a data map using Flourish: Data Map Tutorial PDF
Blog Post 6: Create EITHER a narrative map OR a data map using the tools we practiced on Monday and Wednesday and see the prompt below:
- If you choose a narrative map using StoryMap JS, it must have a minimum of five slides/panels to tell a story about an event related to the readings about slavery and make use of the available primary sources. Choose a narrative with a strong geographic grounding. Write a reflective blog post about this process and please include a link or embed of your story map.
- If you choose to make a data map using Flourish and the supplied census data (see Wednesday’s tutorial above), practice using different columns of data to represent in your map. Write a blog post about what you were trying to depict in your map and how it helps us understand the history of slavery in the US. Either embed or include a link to your map in you post.
Week Seven: Digital Art History, Visual and Material Culture
Monday, 11/9:
Discuss Reading: Miles Introduction and Chapter 1
Technical Activity: Engaging Art History and Historically/Culturally Sensitive Objects
Political Cartoon: The Freedman’s Bureau (1866)
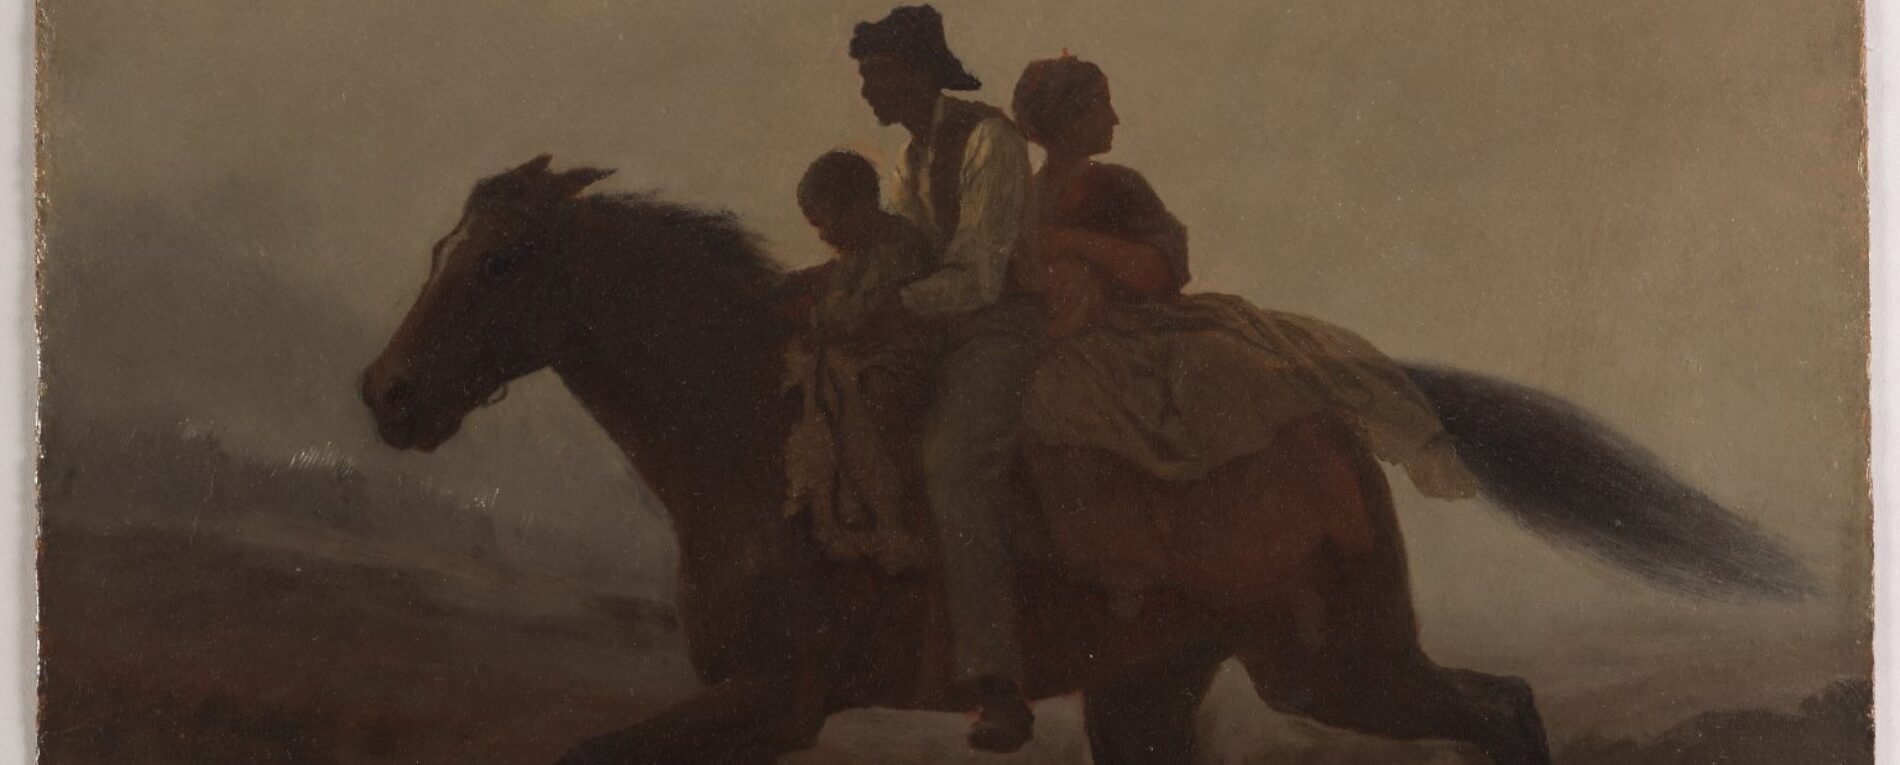
Eastman Johnson’s A Ride for Liberty (1862)
Henry Ossawa Tanner (African American artist) The Banjo Lesson (1893)
Protecting sensitive visual culture: https://mukurtu.org/about/
See also: Tara Robertson, “Digitization: Just because you can, doesn’t mean you should”
Wednesday, 11/11:
Discuss Reading: Miles Chapter 2
Technical Activity: Tropy Tutorial + Discussion of using material culture as historical sources
Blog Post 7: Imagine that you were recently hired to write object labels for a museum that is hosting a new exhibit on the history of slavery in the United States. Using the websites listed below, find a historical material object related to this topic and write a label that will appear next to it while on public display. Your label should be brief (60-80 words is the average length of a label), so you must decide on the most important information to include in the label. Analyze the object itself, find clues to better understand its purpose/meaning, and try to explore the context of its production as well as the context for understanding its significance. Your blog post will include a picture of the object, the museum label, and a reflection on the silences happening in museums as well as the challenge of writing/presenting history for the public. The total word length (label + reflection) should be at least 350 words.
- The National Museum of African American History and Culture
- Smithsonian (all institutions)
- National Museum of the American Indian
- American Civil War Museum
- The Digital Public Library of America
Week Eight: Text Analysis
Monday,11/16:
Discuss Reading: Miles Chapter 3
–Mining the Dispatch digital project
-Benjamin Schmidt and Mitch Fraas, “The Language of the State of the Union,” The Atlantic Monthly January 18, 2015.
Technical Activity: What is text analysis? Introduction to Voyant:
- Download the data from Documenting the American South database, “North American Slave Narratives” (last blue bullet point on page): https://docsouth.unc.edu/neh/. Also, browse this website page for more information about what is contained in these collections, especially the page, “Guide to religious content in Slave Narratives.” Select a theme that interests you.
- After downloading the entire database, it will appear as a zipped folder in your downloads called “na-slave-narratives”; take note on where it is (folder, desktop, wherever it is easiest to access).
- Extract/unzip the folder.
- Click the folder “data” and then the folder “texts”, clicking on it will show each text file. Try to locate the file names that would match the people under your theme of interest.
- Go to voyant-tools.org, click “upload”
- Select the text files you wish to upload (the total number is up to you- for example, if you are interested in the theme “marriage”, you could upload all files related to that theme, or just a couple if you want to look more closely at the individuals who provided the narratives).
- Voyant will provide several different visualizations using word frequencies
- Try changing terms, tinker with the visuals, etc.
- You can export an individual visualization as an image file to your computer (and use it in a blog post!)
Check out the official Voyant guide for help on how to use the tools: https://voyant-tools.org/docs/#!/guide
Wednesday, 11/18:
Discuss Reading: Miles Chapter 4
-Safiya Noble, “Google has a Striking History of Bias Against Black Girls,” TIME, March 26, 2018.
Technical Activity: Voyant refresher, explore the Cherokee Phoenix on Chronicling America
Use the advanced search function on Chronicling America to search in a specific newspaper, or select “browse issues” on the pages below.
Cherokee Phoenix (1828-1829)
Cherokee Phoenix and Indians’ Advocate (1829-1834)
Blog Post 8: Choose either the North American Slave Database (Monday) or the Cherokee Phoenix newspaper (Wednesday) and think of a research question relevant to that source. Next, upload the appropriate document(s)* into Voyant and explore how word frequencies might help to answer your question. In your blog post, write about which source you chose, your research question, and how text analysis (using Voyant) might help you begin to answer that question. You may also include reflections about using Voyant and the advantages/disadvantages of text analysis. Please include at least two images from Voyant to illustrate your points.
*You do not need to upload entire databases into Voyant, select enough documents to be able to answer your research question.
Week Nine: Data Analysis
Monday, 11/23:
Discuss Reading: Miles chapter 5
-Kosara, Robert. “Spreadsheet Thinking vs. Database Thinking.”Eagereyes, April 25, 2016. https://eagereyes.org/basics/spreadsheet-thinking-vs-database-thinking.
-Wickham, Hadley. “Tidy Data.” Journal of Statistical Software 59, no. 10 (August 2014). http://www.jstatsoft.org/v59/i10/paper. (Focus on pages 1-11.)
Technical Activity: Received Data v. Derived Data
-
- George Washington’s List of Enslaved People 1799, Mount Vernon
- Brainstorm variables for columns (in class Google Doc)
- See also: Slavery Database, Mount Vernon
- See also: Voyages: Trans-Atlantic Slave Trade Database
- See also: Berry Slave Value Database
- George Washington’s List of Enslaved People 1799, Mount Vernon
We have two very different data sources to work with today. Nonetheless our plan of investigation should be the same.
- Is this a primary or secondary source?
- Is this data structured or unstructured?
- Structured: data that can be parsed into a rectangular form with clear variables?
- Unstructured: data that is undifferentiated strings (e.g. words and paragraphs with no structural mark-up)
- If the data is structured, what kind is it?
- Received: a primary source that was formed as a data set at its point of historical creation (e.g. census data, financial records, a membership roster, GW’s 1799 list)
- Derived: a secondary party has examined primary sources and used the information from them to create a data set (e.g. Voyages, the Berry Slave Value Database, and the Mt. Vernon Slavery Database)
- Metadata: data created by secondary party to describe a particular primary source or group of primary sources (e.g. a library catalog record, metadata for an Omeka item); metadata is a kind of derived data
- What is the data’s context of creation?
- What kinds of questions does it allow us to ask about history?
- What kinds of questions does it not allow us to ask?
See Also:Wednesday, 11/25: NO CLASS
No blogging assignment this week
Week Ten: Other Data Visualizations
Monday, 11/30:
Discuss Reading: (catching up from last Monday, 11/23) AND: Miles Chapter 6
Technical Activity: Received Data v. Derived Data ( see Monday 11/23’s technical activity)
Wednesday, 12/2:
Discuss Reading: Miles Chapter 7 and 8
-Optional: Gibbs, Frederick W. “New Forms of History: Critiquing Data and Its Representations.” The American Historian, 2016.http://tah.oah.org/february-2016/new-forms-of-history-critiquing-data-and-its-representations/.
Technical Activity: Building Other Data Visualizations
–> Building Other Data Visualizations in Flourish Tutorial + Datasets
- End of semester conversation + reflection
*Please submit a Course Evaluation in the SIRS System, I appreciate your feedback! 🙂 *
Blog Post 9: Using the data of your choice (linked in PDF Tutorial), think of a research question related to the history of slavery and create a visualization in Flourish. In your blog post, embed the visualization or paste the public link and explain your experience of building the visualization. Include a discussion of your choices regarding the variables you are representing, the choice of visualization, appearance, and scale. Do you think other visualizations could have worked with this data? Why or why not?
Week Eleven: Final Revision and Reflection Blog Essay- DUE Dec. 9th
Final Blog Essay Prompt: Please write a reflective essay as a longer blog post (about 1000 words) that will have two components:
First, revise and expand one of your digital history creations from the previous weeks. Was there a particular tool or skill that was your favorite? Or, perhaps there was a challenging one that you would like to reattempt? You might explain the context of using the tool/skill you selected, the process of using it, the data you are using with the tool (and why), and the significance/critiques of the results. Be sure to include any relevant images/visualizations to illustrate your points.
Secondly, reflect on your entire portfolio of work and your experience with “doing digital history.” How might certain aspects of this course echo into other parts of your work and life?
Monday, 12/7: No class meeting, BUT I will be in our Zoom room during our normal class time (3-4:50pm EST) to answer any questions, offer refresher tutorials, troubleshoot problems, work through your ideas, etc.
Wednesday, 12/9: No class meeting, BUT I will be in our Zoom room during our normal class time (3-4:50pm EST) to answer any questions, offer refresher tutorials, troubleshoot problems, work through your ideas, etc. ***Final Revision +Reflection Blog Essay DUE TODAY by 11:59pm (EST)***